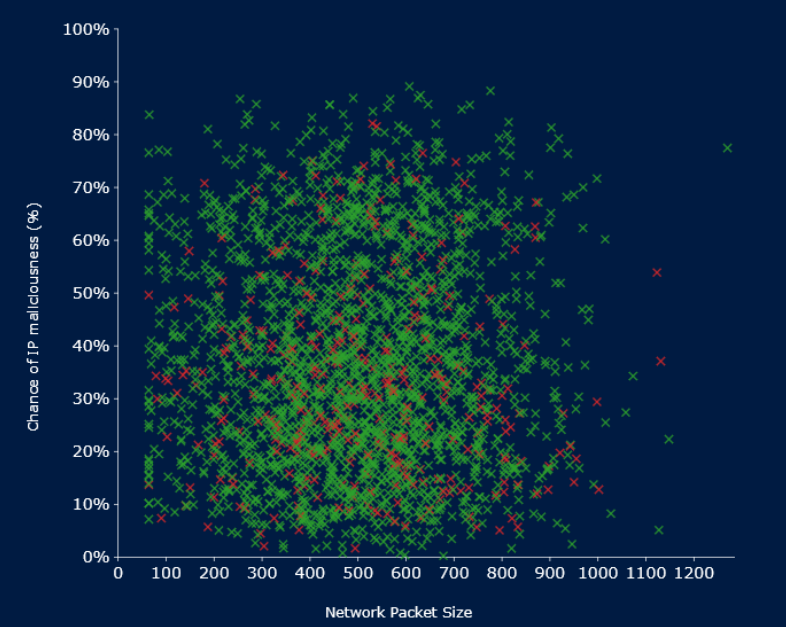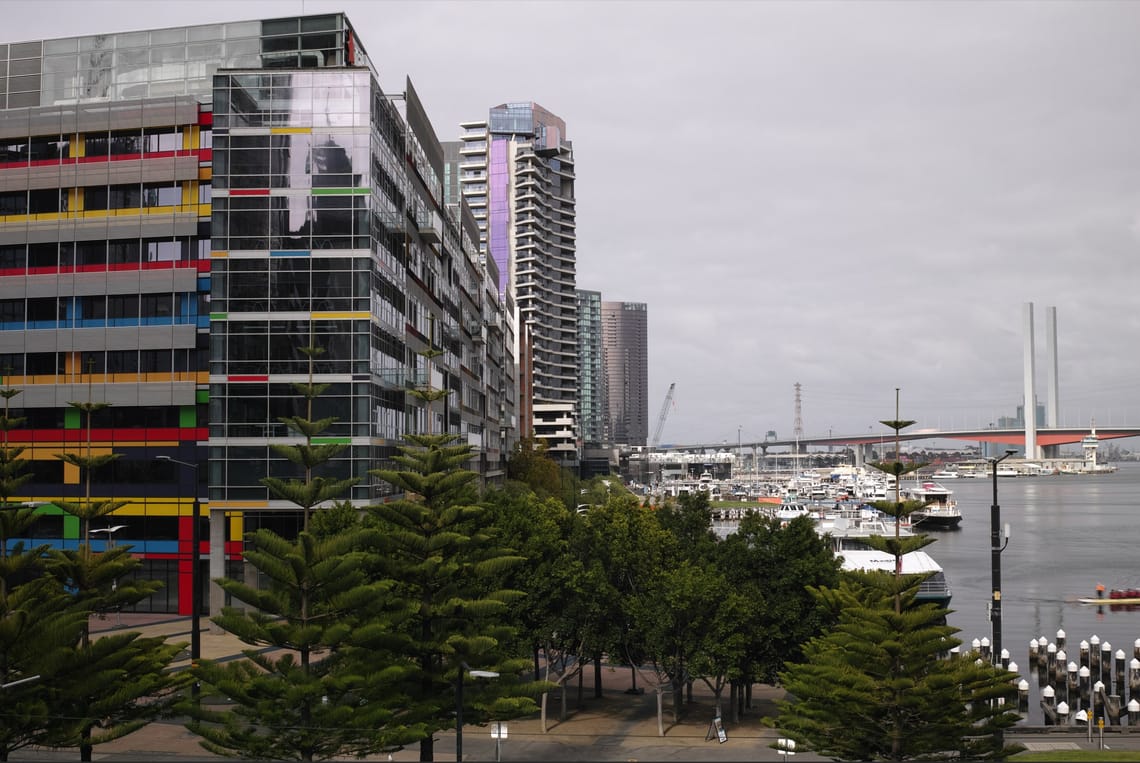
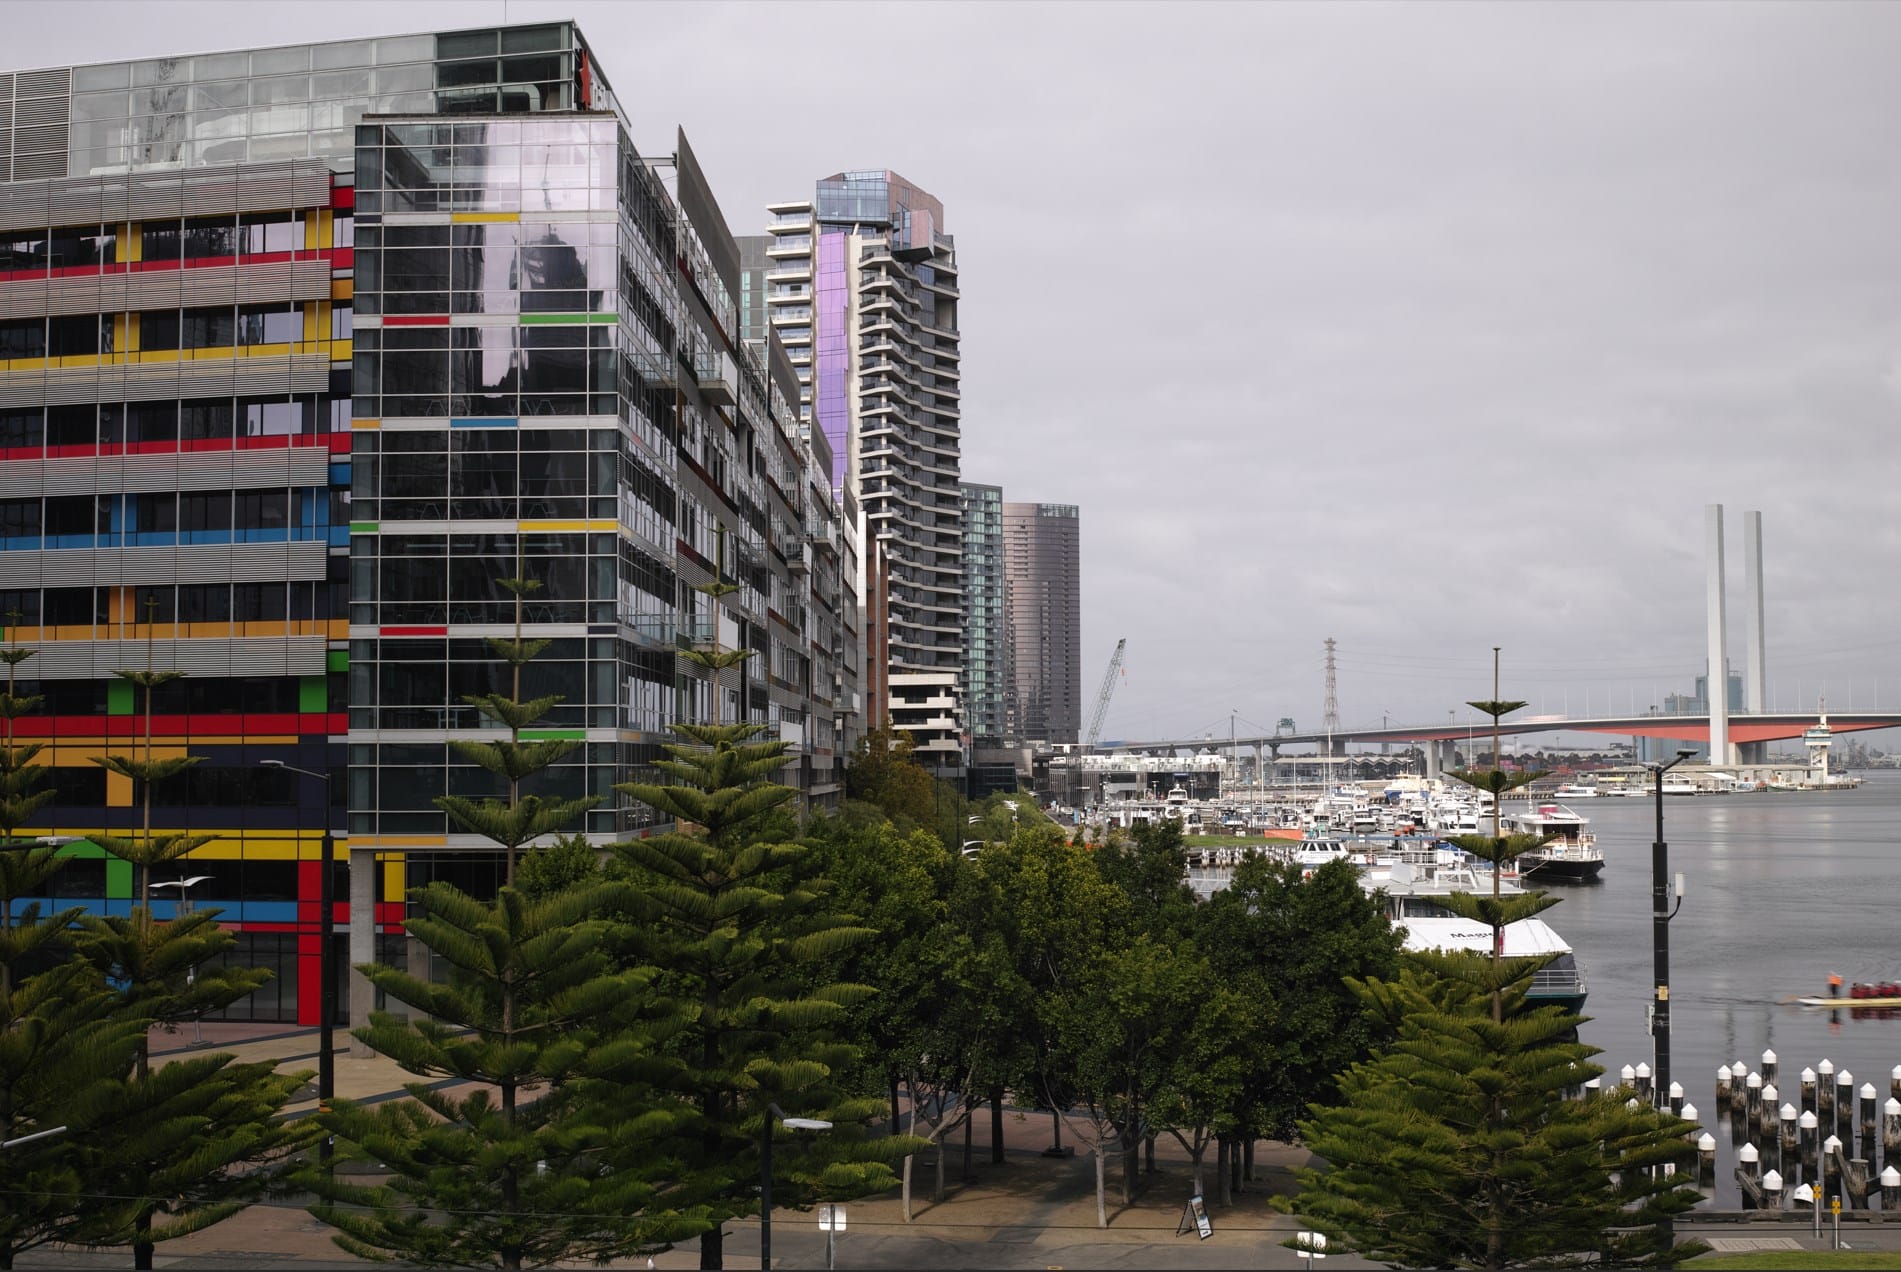

Looking back through the camera roll, I sometimes come across random images with no apparent focus or interest. What did I like about the scenery? What compelled me to create this snapshot in time? The bridge in the distance is brighter but less saturated, the foreground is saturated yet dull, and there is a mix of colourful warping reflections.
As I pondered this, I wondered, what if the pixels could say something to me? They can't talk, but there was something interesting I could do. The SIGMA DP2M camera has a proprietary image format called .x3f, which captures a red, blue, and green pixel on separate layers. If we converted the image into a CSV file, could we piece together anything meaningful?
Before I could begin analysing it, I needed to extract and clean the data. Normally, this would be a simple R script to extract everything. However, there are a few problems unique to this camera:
- There isn't much known about the .xf3 image format, so cleanly extracting the pixel data without conversion could be problematic. However, we also don't want to lose information.
- A .tif is great for this, but this creates another problem. The image dimensions are approximately 4704 * 3136 * 3 with a base file size of 100 MB. Creating a single one-to-one CSV would result in more than 14 million lines and be at least 300 Mb. R can somewhat handle this, but something like Power BI struggles to manipulate it quickly enough.
These problems can be solved later in a few different ways; for now, let us focus on making the first CSV file.
from PIL import Image
import csv
import numpy as np
import os
def path_setup():
filepath = "image_colour_extract/data/" # Assuming 'data' folder is directly in the working directory
filename = input('Enter the name of the image and file type: ')
os.chdir("..")
full_path = os.path.join(os.getcwd(), filepath, filename)
print("Current Working Directory:", os.getcwd())
print("Attempting to open:", full_path)
while not os.path.exists(os.path.join(os.getcwd(), filepath, filename)):
filename = input('Please try again, enter the name of the image and file type: ')
print(filename)
print("Current Working Directory:", os.getcwd())
print("Attempting to open:", full_path)
print(os.path.join(os.getcwd(), filepath, filename))
full_path = os.path.join(os.getcwd(), filepath, filename)
return full_path
def image_setup(full_path):
image = load_image(full_path)
print(image.size, image.mode, image.format)
return image
# Getting image ready for numpy array
def load_image(filepath):
return Image.open(filepath)
# Getting image ready for numpy array
def image_to_array(image):
return np.array(image)
# A numpy array is capable of reading the channels and pixel co-ordinates.
# This is faster than doing a nested for loop for the XY co-ordinates.
def flatten_image_data(image_array_extraction):
rows, cols, channels = image_array_extraction.shape
index_grid = np.arange(rows * cols).reshape((rows, cols))
x_grid, y_grid = np.meshgrid(np.arange(cols), np.arange(rows))
flat_data_extraction = np.column_stack(
(index_grid.flatten(), x_grid.flatten(), y_grid.flatten(), image_array_extraction.reshape(-1, channels)))
return flat_data_extraction
# At the moment, this is only for writing a single tif file, this will overwrite the current csv if it exists.
# We need to add an if statement incase there is an alpha chanel
def save_to_csv(data, image, filename_extract_output):
with open(filename_extract_output, 'w', newline='') as file:
colour_mode = str(image.mode)
if colour_mode == 'RGBA' or colour_mode == 'RGBX':
writer = csv.writer(file)
writer.writerow(['Pixel_Index', 'X', 'Y', 'R', 'G', 'B', 'A']) # Header
writer.writerows(data)
else:
writer = csv.writer(file)
writer.writerow(['Pixel_Index', 'X', 'Y', 'R', 'G', 'B']) # Header
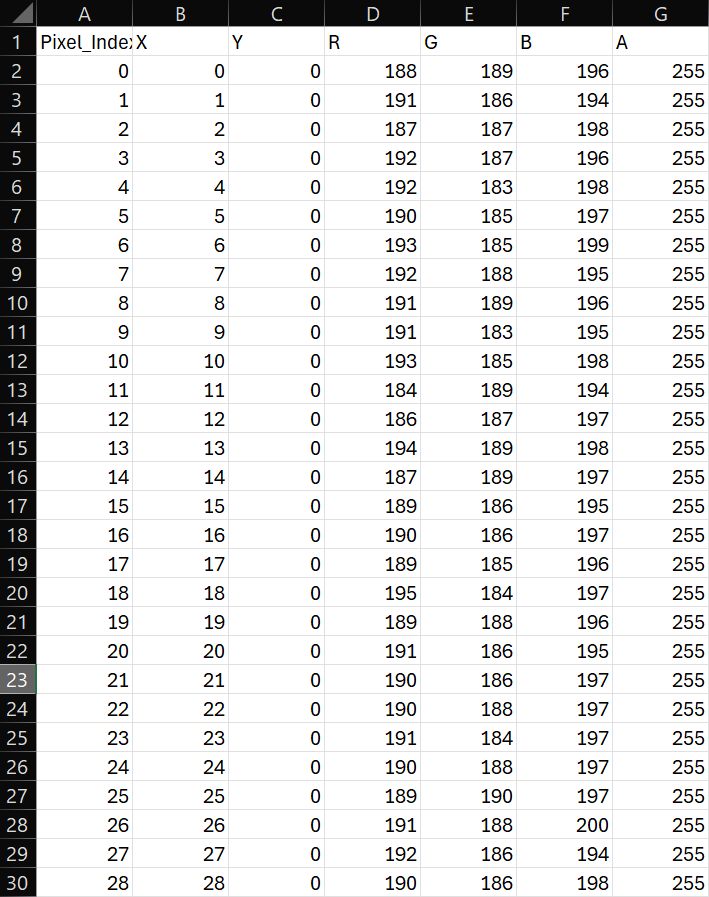
writer.writerows(data)To summarise, the image is converted into an array, and pixel by pixel, we get the coordinates, the RGB values, and the position it is within the array. At a later date, I would like to make a version that can batch multiple images, but for the purposes of testing, this will suffice. Our end result should look something like this:
From here, I will need to clean and edit the output to make it easier to manipulate in software. This will be explained in part two.